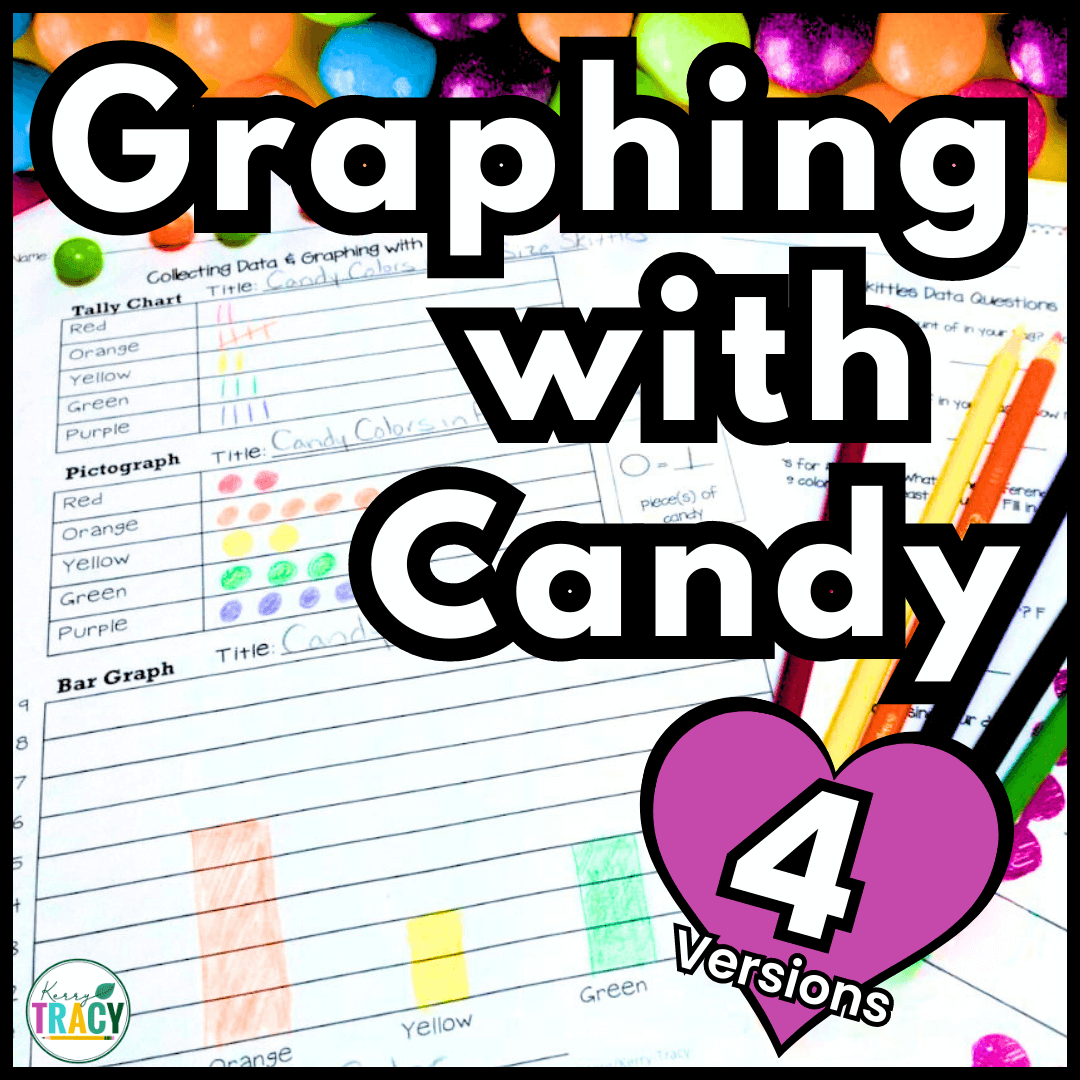
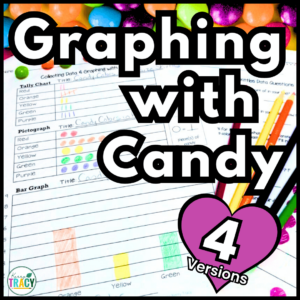

This 2nd-grade activity helps teach/review basic graphing skills: tally marks, bar graphs, pictographs, line plots, and answering questions based on data.
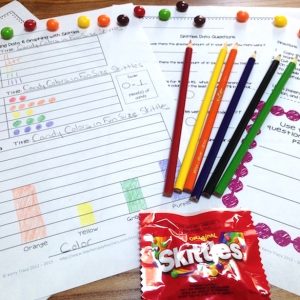
Click here to read the Graphing with Skittles blog post.
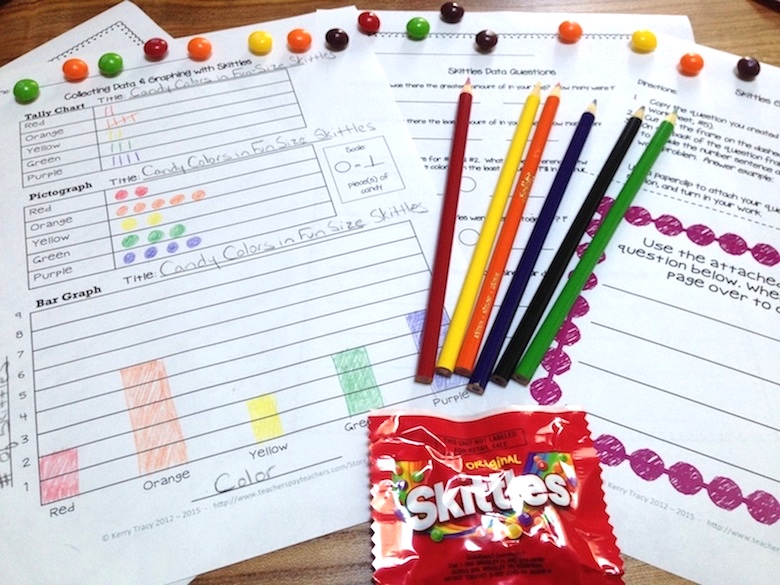
The end product is colorful and substantive. I glued their graph page next the the answering questions based on data page on 12×18 in. construction paper. It looks great hanging on the wall for Open House, Back-to-School Night, or anytime, really!
Students sort Skittles by color and:
– Create a tally chart
– Create a pictograph
– Create a bar graph
– Create a line plot
– Answer questions related to their data
– Create a question using their data
This download includes:
- Teacher directions
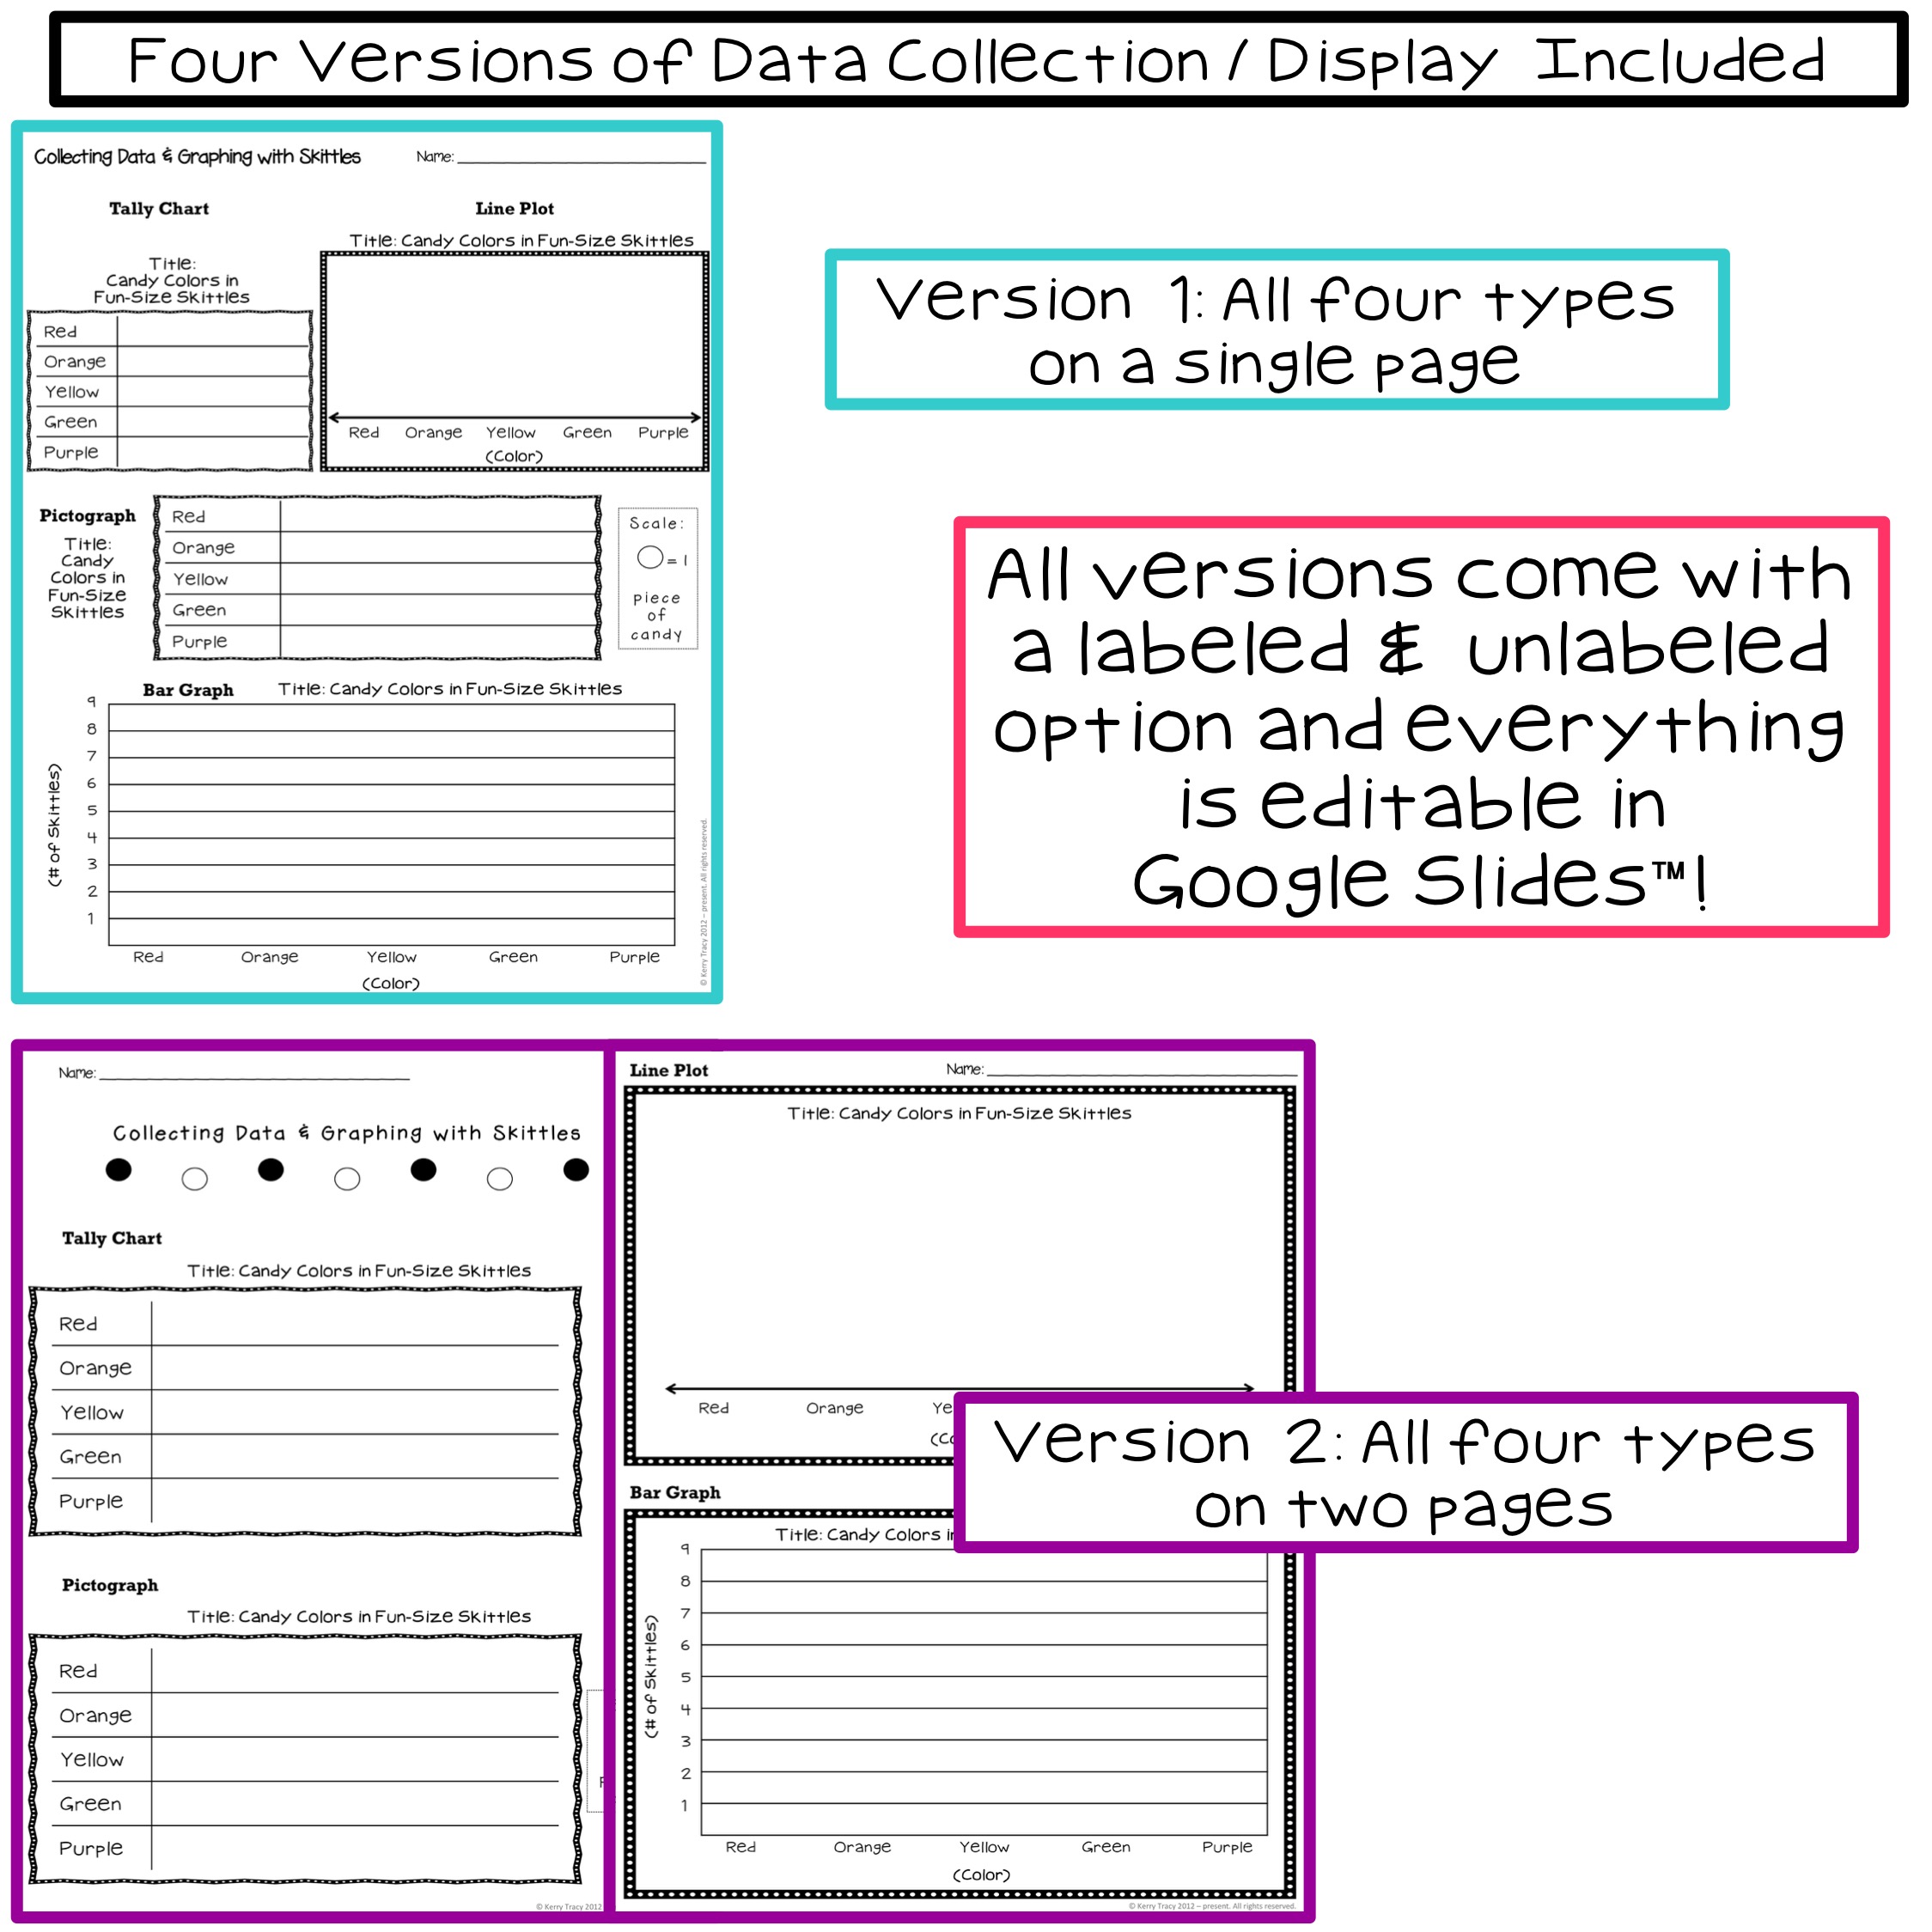
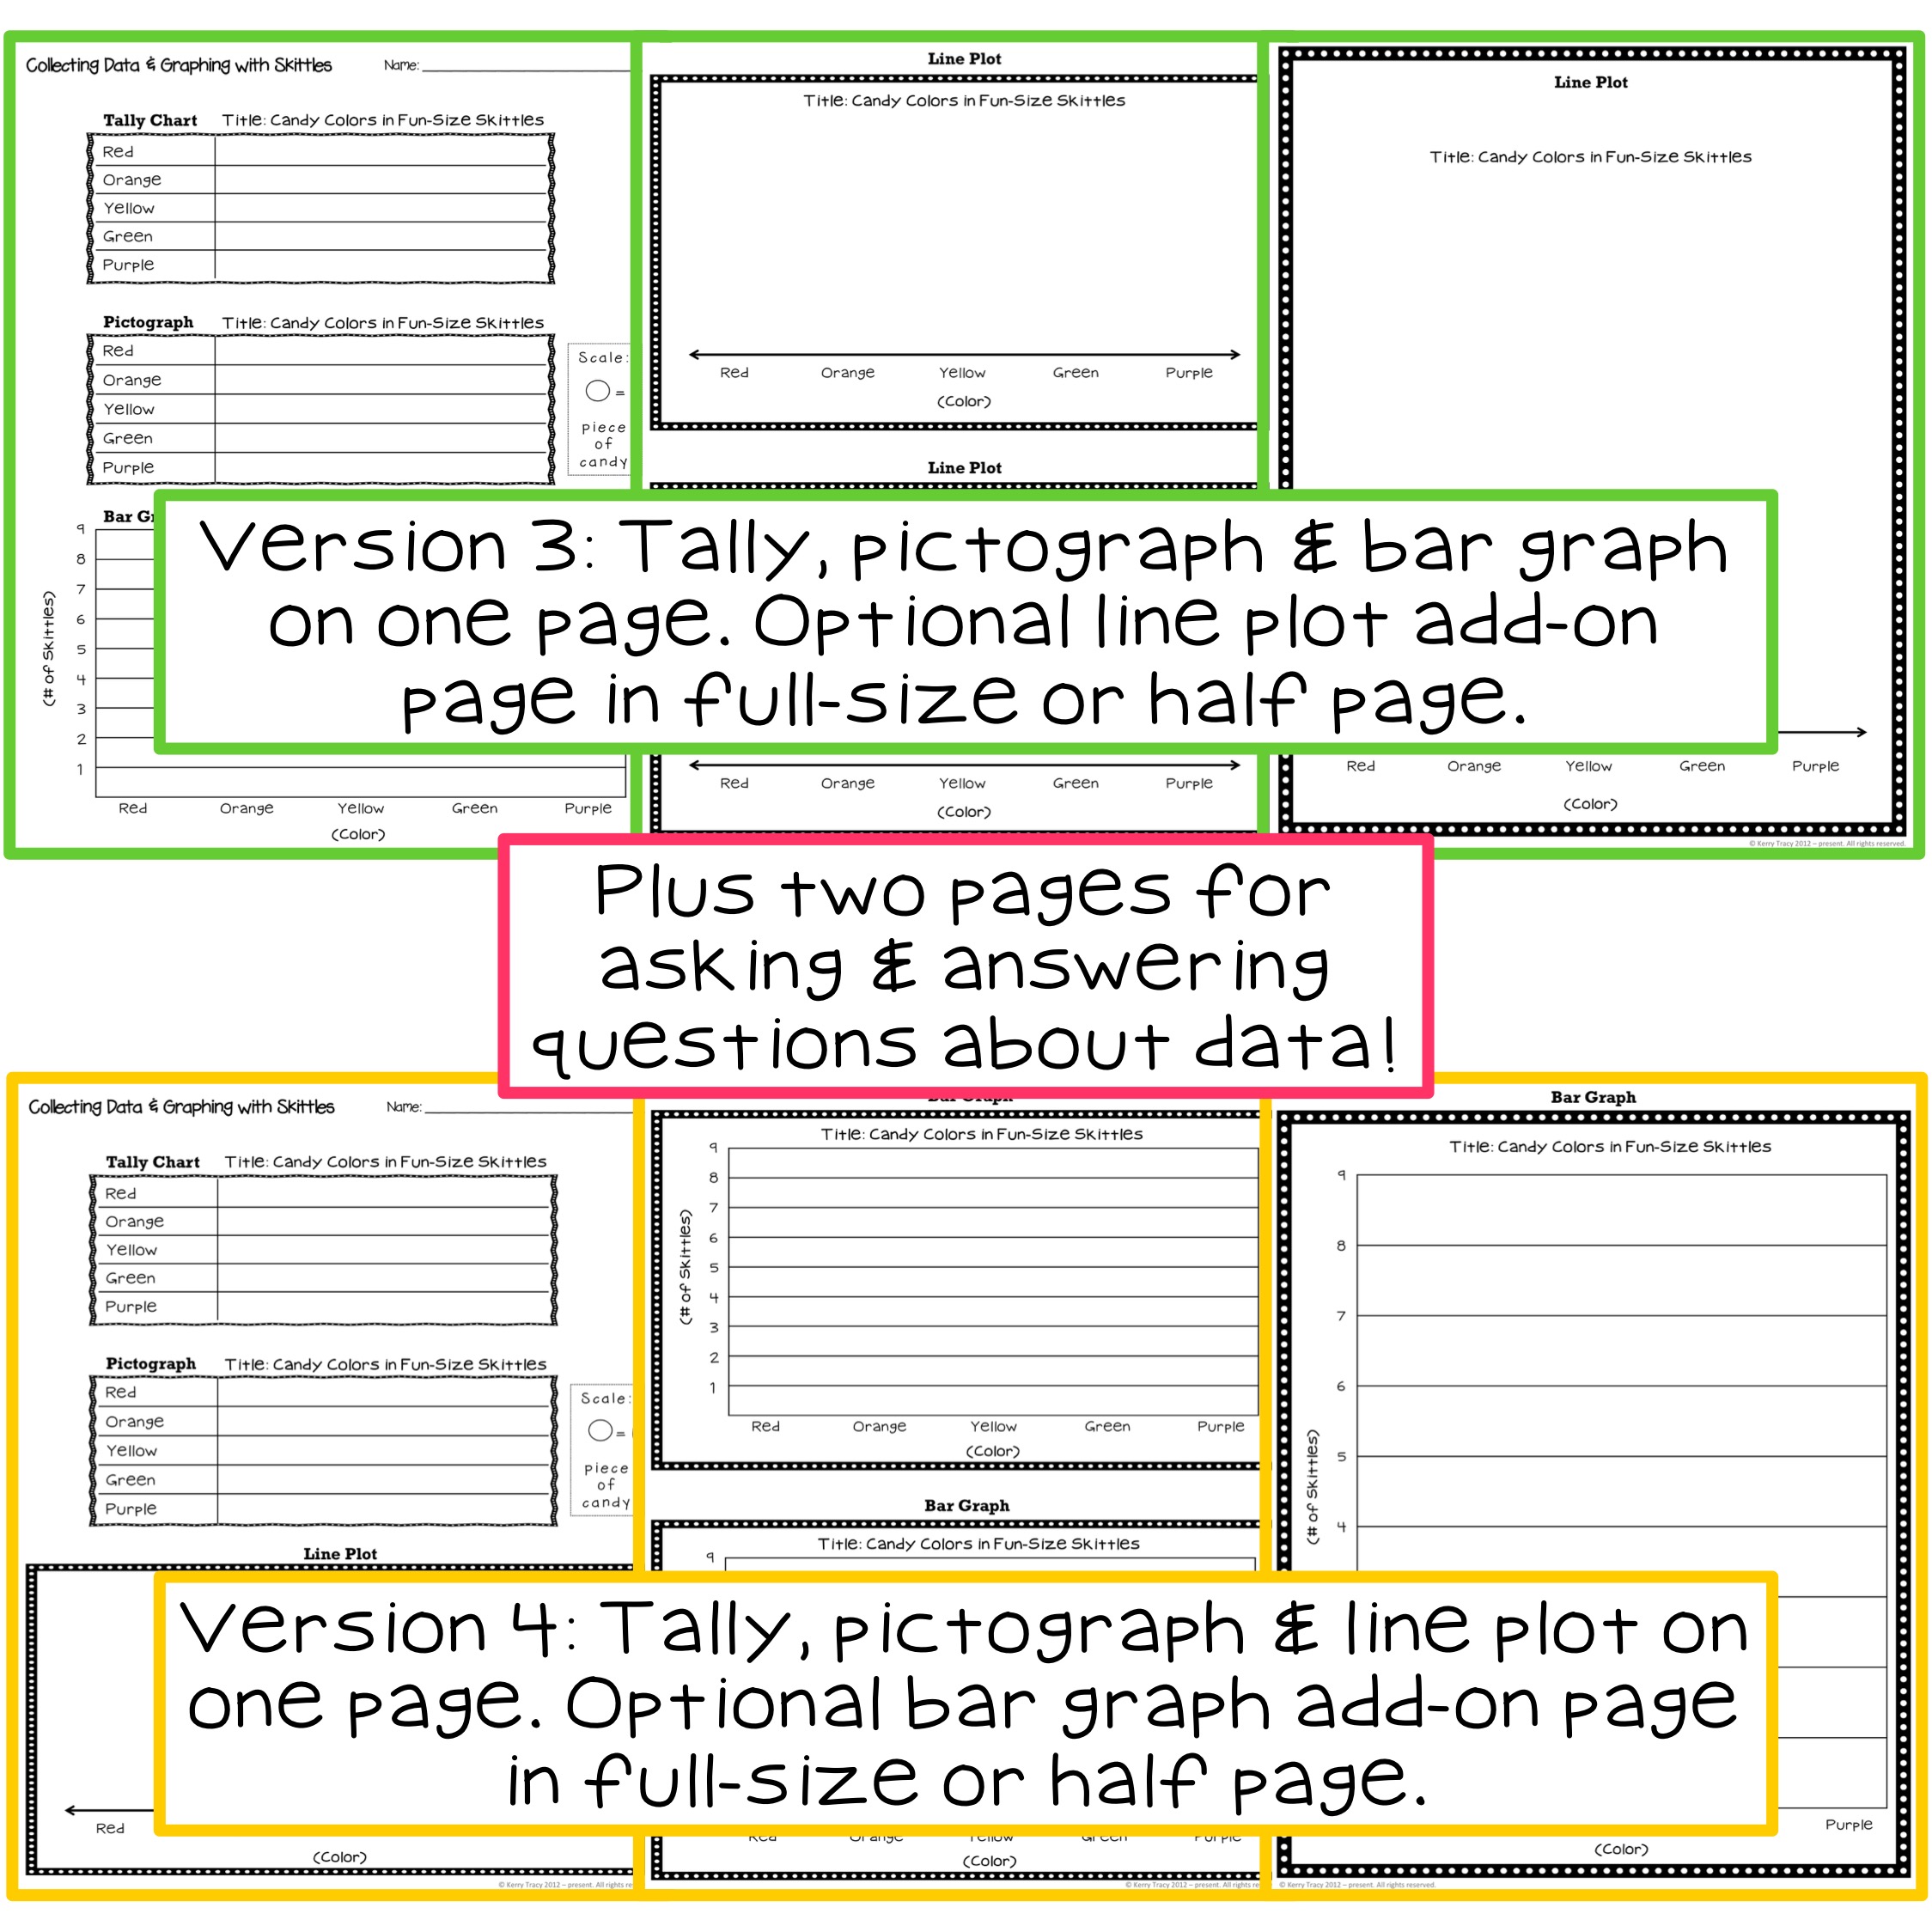
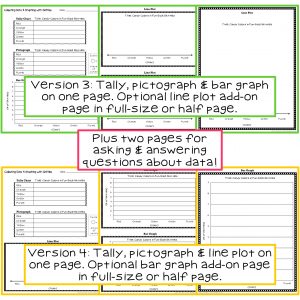
- Four versions of data collection display to choose from (see details in the preview)
- Each version has an option with all labels filled in (titles, x-axis, y-axis, scale) and another option where students fill in all labels
- One student page for using data to answer/create questionsOne bonus student page to create question cards to share with others for extra practice
- An editable file, so you can make adjustments, if you like!
Socopa Corretora –
My brother suggested I might like this website. He was once entirely right.
This publish actually made my day. You can not believe
simply how so much time I had spent for this info! Thanks!