Using candy in the classroom has become a debate point, and for good reason. We should be conscious of helping students understand the importance of good nutrition, but I think you can do that and still subscribe to the “all things in moderation” philosophy. Introducing a little sweetness, on occasion, to graphing can turn an average lesson into something special!
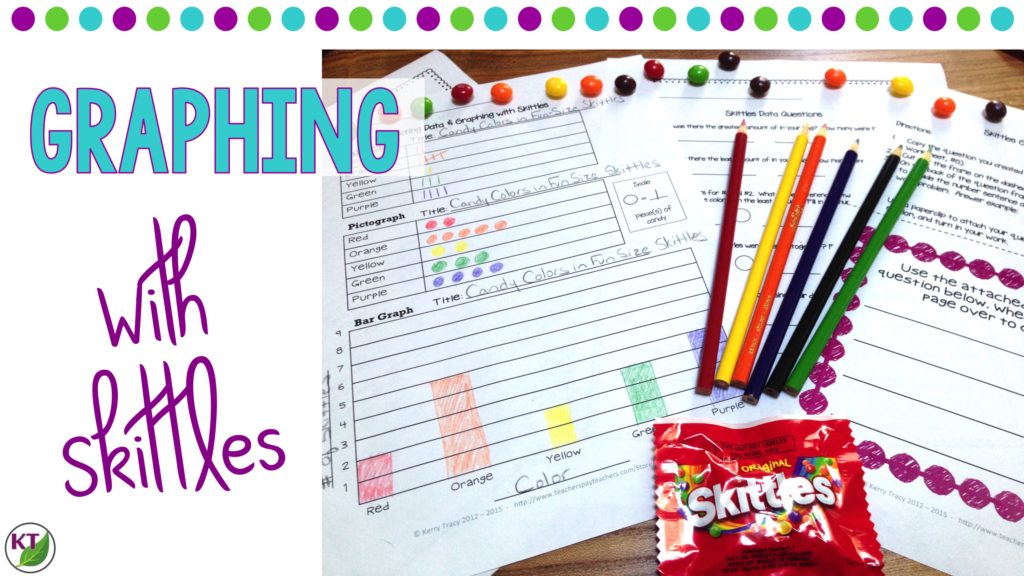
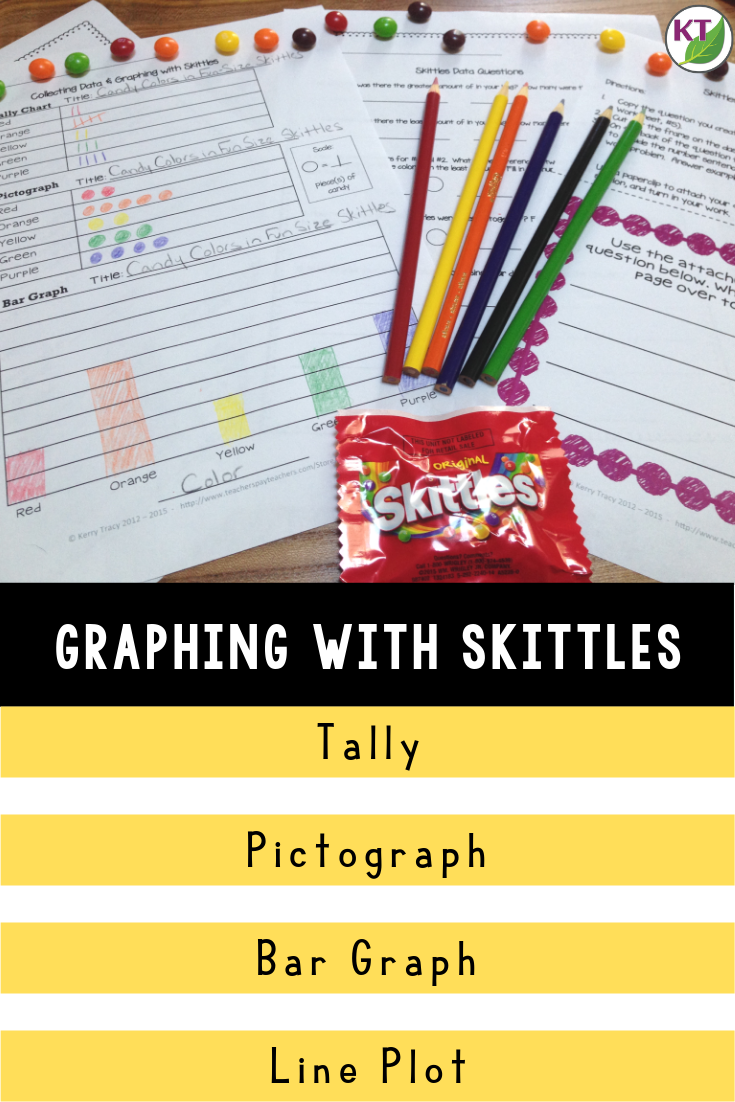
Graphing with Skittles is a student-favorite. I developed this lesson when I was teaching second grade because I wanted a quick way for students to review tally marks, bar graphs, pictographs, and line plots all on one page. Representing data in various ways is a key second-grade skill. Because candy is at the center of this lesson, it works well at Halloween, Valentine’s Day, or any time you want to make sure the engagement is high (test prep, anyone?).
The Lesson
- Purchase Fun Size Skittles for each student.
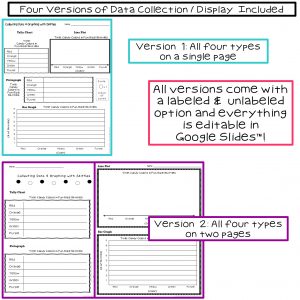
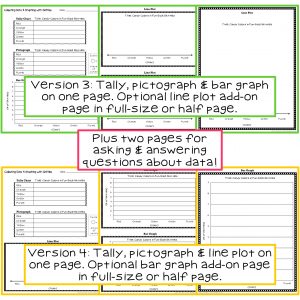
- Make copies of student graphing sheets. If you use my resource, there are four versions of the graphing page and each one has a labeled (titles, axis labels, and scale pre-defined) and unlabeled option. Plus, all the pages are editable in Google Slides, so you can make any changes you like.
- Tell students they will use the Skittles to practice their math skills. When they have completed both pages and have their work checked, they will be allowed to eat the Skittles. (If/when you get backed up checking their work, tell them to have a partner check their work before they come to you.)
- Have students :
- Sort the Skittles by color/flavor
- Record data using tally marks
- Record data in the pictograph
- Record data in the bar graph
- Record data in line plot
- Use data to solve word problems
* Use the opportunity to review key words in word problems such as:
- Altogether
- In all
- How many more _________ than ___________
- Difference
- Fewer
- Less than
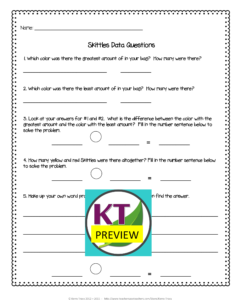
5. When students are done, they may eat their candies and circulate the class to answer word problems (see #6, Option 1 below).
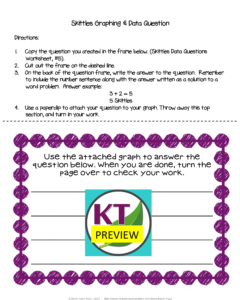
6. Option 1: Have students create a word problem based on their graph. Have them write the answer on the back of the question page; then clip the question to the data page and have students trade or use in centers.
Option 2: Display graphs and data questions side-by-side. Use the bulletin board as an option for early finishers to solve word problems.
If you want to save time creating the student handouts, you can pick them up in my TpT store.
Pin Me!