
Are
you guilty?
neglecter?
flash, but no bang?
latter-steps neglecter, and I want you to know there is hope & the grass is
so much greener on the other side!

Background
I spent
most of my ten years teaching 5th grade. I moved down to second grade to shock
the system for two years, and then up to 7th Life Science & ELA, which is
where this story begins.
The Scientific Method
Students are usually given the most experience with the first four steps of the scientific method:
1) Ask a question or state a problem
2) Do background research
3) State a hypothesis
4) Test the hypothesis with an experiment
But we frequently don’t give as much time and practice to the final two steps:
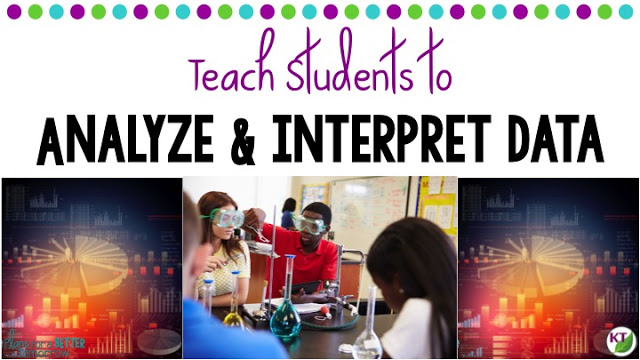
5) Analyze data and draw conclusions
6) Report results
This often occurs because we run out of steam or class time after performing experiments, and the result is that students simply don’t get enough instruction and experience with the higher-level thinking skills involved in making meaning from their experiment results…and that’s the most fascinating part!
Data Analysis: Osmosis Doesn’t Work
science experiment reports I collected were underwhelming, to say the least. In
their reports the students explained the hypothesis, procedure, and results
with absolutely no analysis or critical thought.
How on Earth had they missed the most important element of their reports?! It seemed they missed the point of conducting experiments entirely. Hadn’t anyone taught them to analyze and interpret their results?
What a tremendous waste of time trying to grade these reports would be!
 |
| If there’s a better way to show the whirlwind of emotions as I read those reports, I couldn’t figure it out! |
all doing it wrong, you have to pull up your big teacher pants and admit you made
the classic error of assigning rather than teaching.
to guilt as I recalled the ghosts of experiments in years past where my class performed
an experiment but ran out of time to go much further. Visiting my classroom on
those days, you might have thought there were only four steps to scientific
method! With all the good intent of following up the next day but little quality follow-through,
these crucial latter steps were often short-changed. All too often, I trusted the students would just inherently know what their results meant. Now my neglect was coming back to haunt me –
cruel, cruel karma!
(really re-do) the reports.
When Teaching Data Analysis, Begin with the End in Mind
support materials, but I just couldn’t find what I needed to dig deep on
thinking critically about data. My epiphany moment came when I realized what I
really wanted to do was to shift the imbalance of class time to the latter part of the scientific
method. I didn’t have the luxury of time (who does?!) to run full
experiments and generate data to then teach data analysis. Plus, my students had already shown they knew how to run experiments and record results!
We didn’t have to do the entire experiment for multiple experiments to get what I was after! What we needed was a set of completed experiments/investigations we could analyze, draw conclusions, and suggest next steps.

configuration possible. I was desperate to find resources, but I came up empty.
again.
I wanted wasn’t out there.
do: when you can’t find it, make it!
the:
Analyze & Interpret Data Unit
{Read on for a freebie application/assessment sheet!}
Each lesson I created includes editable PowerPoint presentations and student notes/practice. Below, you can see my lesson sequence:
Lesson 1: The Scientific
Method and Variables
scientific method
terminology (trials and theory)
identifying independent variable, dependent variable, and control variables
Lesson 2: Making a Line
Graph for Science Experiment Data
the x-axis
on the y-axis
scale
line graph
labels
 |
| PIN ME FOR LATER! |
Lesson 3: Identifying
Relationships Between Variables
independent and dependent variables have a direct relationship, inverse
relationship, or no relationship
Lesson 4: Analyzing
Results, Drawing Conclusions and Next Steps
correct, or incorrect
re-design, expansion, etc.)
Lesson 5+:
Application/Assessment
worksheets for class, homework, and/or tests
five experiment scenarios*:
grades?
impact speed?
affect Diet Coke explosions?
ingredients healthier?
each scenario, you can have students compare different trials of the same
experiment to graph as a double line graph, analyze data, determine next steps,
etc. Or you can use them as stand-alone practice. When the students recognize
the scenarios, it is another opportunity to remind them that good science
requires multiple trials of the same experiment.
experiments. The data tables are made up. The free product (link below) in my
store is version A of this activity, so you can see exactly the format you will
be getting.
All’s Well that Ends Well
After two
weeks of focused instruction and practice in identifying variables, setting up line graphs, determining variable relationships, drawing conclusions, and generating next steps, I asked students to revise their original experiment
reports.
it? The revised reports showed fantastic growth in scientific thinking. Grammatical errors and general organization would have to wait for another day … baby steps — tackling one hurdle at a time!
Who
would’ve guessed – when you teach students what to do, they’ll often surprise you and do it!
Learn More
store, so you don’t have to reinvent the wheel. As excited as I was to use
these lessons with my own students, it gives me immense pride knowing other
teachers and students I’ve never even met have also benefitted! Here’s what
teachers have to say about the Analyze & Interpret Data Unit:
 |
| CLICK HERE |
“Data analysis conquered! Thank you!”
“This is a LIFESAVER! I have been struggling to find a concise way to explain data analysis to my kiddos and this exceeds my needs by a long shot! Thank you SO much for such a useful product!”
used to struggle in. But with this well thought out product my students were
able to understand and consistently interpret data”
with analyzing data and graphing. Love it!!”
graphs and analysis!”
understand things like the different types of variables, and next steps.
Thanks!”
used it as an in class assignment with grade 7 and 8 students, then chose a
different topic as a quiz. I really like that there were several different
topics and data sets so that I could introduce the topic, then have the
students work through it themselves. Repeating the questions and vocabulary is
very helpful for my weaker students.”
after year!”
A Tip & a FREEBIE
For so many of the early elementary years, students receive admirable practice in the early stages of the scientific method. Students in upper elementary and middle school will need focused practice on how to interpret results. Having sets of experiment data will give you a head start in preparing instruction and practice for your kids in these critical thinking skills!
Here’s an application/assessment freebie to get
you started on your path to becoming a Data Analysis Teacher Extraordinaire!
 |
|
Whether you use one of my resources or not, I hope you’ll aim to be a super-suave scientific method master and teach your students to do likewise! Check out these other great ideas from some of my favorite bloggers! |

SCIENTIFIC METHOD & WISH LIST FONT CREDIT:
Khys Bosland Fonts
PHOTO CREDITS:
photo credit: Road Side via photopin (license)
photo credit: IMG_1016-2.jpg via photopin (license)
photo credit: IMG_1044-2.jpg via photopin (license)
photo credit: Sam meets the world via photopin (license)
photo credit: Joey Lauren Adams 01 via photopin (license)
photo credit: Goose looking confused via photopin (license)
photo credit: Plantons via photopin (license)